Rip Components
When a beach has sandbars and channels, breaking waves in the surf generate all sorts of water motions. Rip currents are only part of a complex flow pattern.
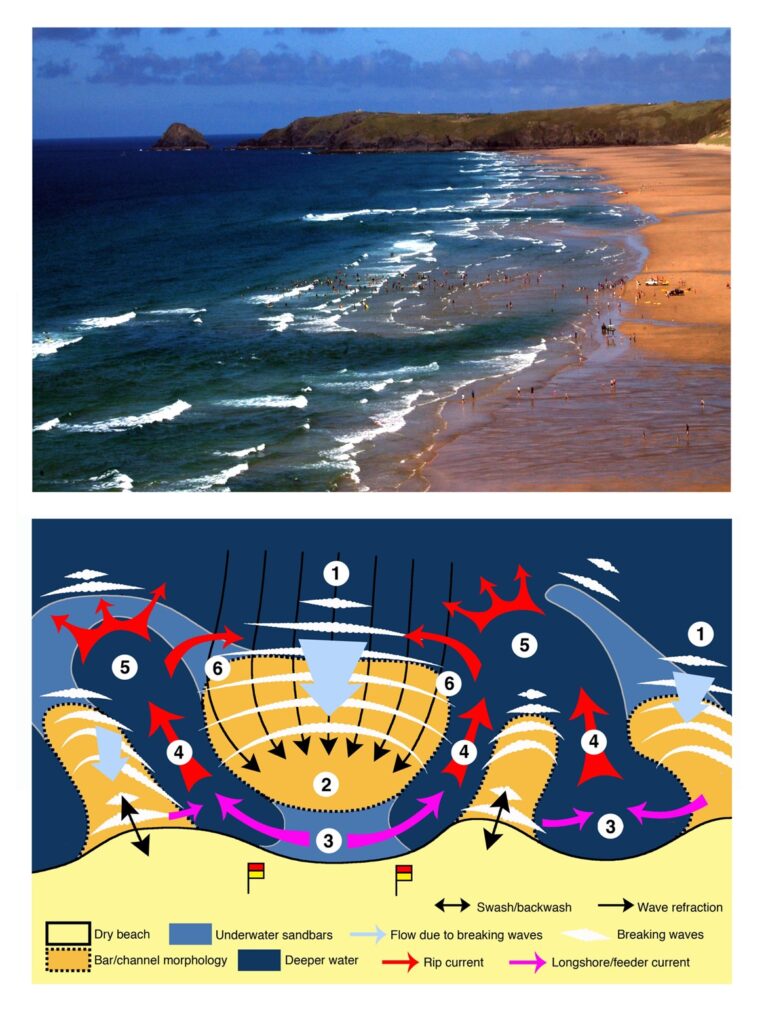
There are a number of components that make up the rip current water circulation system. The image below is a good example of the complex nature of sandbar formations. Rip current channels can often be identified by darker streaks through the surf zone and this is due to the lack of wave breaking in the deeper channels. Rip currents flow in these channels and can often be identified by ‘choppy’ looking water. The diagram illustrates what flows are likely to occur.

Bottom: diagram of above photo, illustrating key parts of the complex surf zone current system.
Breaking waves: The currents in the surf are mainly driven by breaking waves. As waves approach the beach they are focused on sandbars by wave refraction (1) and then break in the shallower water depths over the bars (2) driving a mass of water onshore towards the beach (3).
Feeder current: The mass of water driven towards the beach creates higher water levels at the shoreline, especially in front of the sandbar, and this water must return back offshore to restore balance. To achieve this, the water flows alongshore (called a `longshore’ or `feeder’ current) to the regions of lower water levels where there is less wave breaking occurring (3). Commonly these regions are deeper channels between the sandbars, but they can be any areas where wave breaking is less intense.
Rip current: Rip currents then flow offshore towards the edge of the surf zone (where the waves are breaking) to restore the water balance (4). Rip current flows are strongest in the surf zone (4) and slow down outside the surf zone as they fade away (5). Rips flowing along a headland or structure can travel further offshore than rips associated with sandbars.
Video: basics of rip components
Rip Circulation
Recently, coastal scientists from around the world have been measuring rip currents and have found that rips often flow in a circular pattern, very much like an eddy within the surf zone with only the occasional jet of water extending offshore known as a ‘rip exit’ (see diagram below).

Consequentially, if floating in an active rip current the flow may do one of two things when you reach the edge of the surf zone:
- Rotation: travel back towards the breaking waves (6) then return onshore over the sandbar, referred to as rotation or recirculation; or
- Exit: the rip flow `breaks’ past the sandbars and the line of breaking waves, travelling offshore as the flow spreads out and weakens, referred to as the `rip head’ (5).
Rip pulsations
As waves travel across the ocean towards the coast they increasingly arrange themselves in groups or sets that arrive at the beach anywhere between 30 seconds and 5 minutes apart. Swells that have travelled a larger distance will have longer gaps between wave groups.
As the wave groups break they cause fluctuations in the water levels at the shoreline and current speeds in the surf zone. These fluctuations combined with instabilities in the current can cause dramatic variations in rip current flows and water depths at the shoreline.
These fluctuations (ranging from 30 seconds to 30 minutes) add and subtract from the average rip flow, causing a pulsing of the rip current. Rip pulsing can sometimes result in flow speeds varying from almost zero to faster than an elite swimmer in a matter of seconds and can catch bathers off-guard.
When combined with water depth variations, bathers on a sandbar can be lifted off their feet and moved rapidly toward a more hazardous area or the surf zone.
This graph shows the variation in rip flow speeds over the period of an hour. The measurements are from typical conditions at Perranporth beach during low-tide (wave height = 1.5 m wave period = 12 s).

This graph shows fluctuations in the rip flow occurring every 1-5mins with a strong pulsation at around 00:40.The result provides evidence of a rapidly fluctuating rip current with flow speeds ranging from 0 to 1 m/s.
Marked by the horizontal lines on the graph are the average maximum swimming speed of a member of the public and the minimum requirement for an RNLI lifeguard (400m in 7:30 mins).
