Author Dr. Paul Lunt (Director of the Low Carbon Devon Project)
More than 120 countries have announced new targets to reduce emissions by 2030, and governments representing 70% of global carbon dioxide (CO2) emissions have pledged to bring their emissions to Net Zero by 2050 or shortly afterward. Scientists welcome pledges to end deforestation, reduce methane emissions and commitments from the financial sector of over $130 trillion of private investments into green infrastructure. However, many campaigners have expressed concerns over the failure of past commitments by wealthier nations to provide US$100 billion a year by 2020, to help less wealthy nations adapt to and mitigate the impacts of climate change.
Figure 1 below shows projected increases in average global surface temperatures relative to preindustrial levels (pre-1880’s) for four possible future emissions scenarios. The four scenarios describe different climate futures, all of which are considered possible depending on the levels of GHG emitted in the years to 2100.
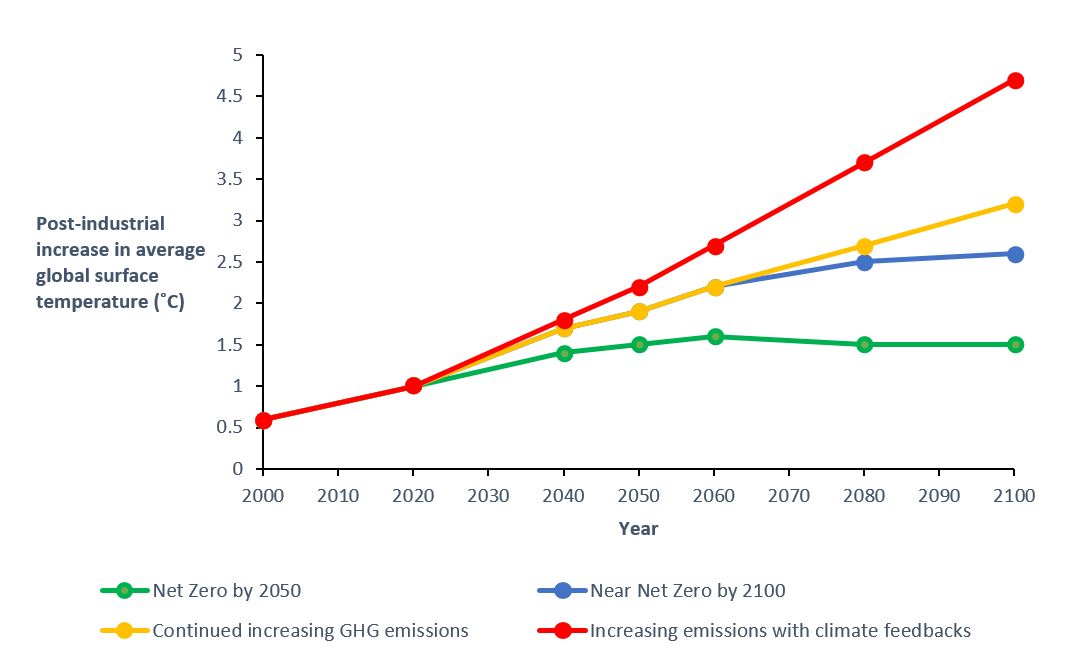
The best possible outcome (green line scenario) is that global greenhouse gas emissions (GHG) emissions are cut by 45% (from 2010 levels) by 2030 and reach Net Zero by 2050. This emissions scenario is in line with the Paris Agreement, limiting increases in pre-industrial average global surface temperatures to 1.5 °C, thereby avoiding the most damaging consequences of human-caused climate change. The Glasgow Climate Pact is a step forward. Yet even with the agreements in place, emissions will continue to rise until 2060 and only then will they be gradually reduced to Net Zero by the end of the century (blue line scenario), resulting in as much as a 2.4 °C temperature rise by the end of the century.
The yellow line shows the “business as usual scenario” with current policies in place and GHG emissions continuing at a relatively steady-state to the end of the century. This emissions scenario is likely to result in a 3 °C increase on pre-industrial global average surface temperature. If this were not fair warning enough, the red line and “worst-case scenario“, is that emissions continue to rise year on year at their present trajectory throughout the 21st century and climate feedbacks such as disappearing Arctic sea ice, loss of the Amazon rainforest and release of methane from the circumpolar permafrost region increase GHG emissions further and increase the severity of the situation.
Following recent pledges by nations to reach Net Zero Carbon by 2050, these frightening scenarios seem much less likely. Increases in average global surface temperatures by the end of the 21st century are more likely to range from a very optimistic 1.5 °C to a possible upper-end value of 3 °C.
———–
Dr. Paul Lunt is the Director of the Low Carbon Devon Project, a European-funded project designed to support Devon-based organisations to access research, business support and engage with the University of Plymouth around the low carbon agenda.